I.
Diary recording of 10-day energy use10天能源使用日志记录
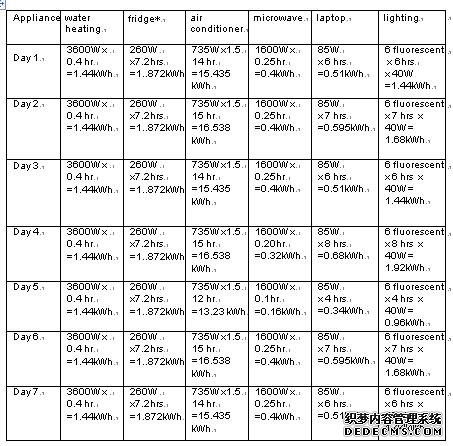
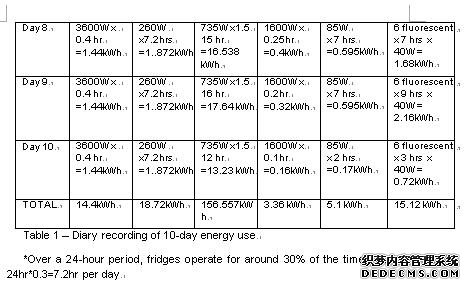
表1记录并介绍了几种电器的能源使用情况。能源使用量是根据设备的功率和每天的使用时间来计算的。
The energy use of the several electrical appliances was recorded and presented in Table 1. The energy use is calculated based on the power of the appliance and the time of using it per day.


II.
Analysis of the energy use能源使用分析
上面的表格涵盖了我生活中的大部分用电,但并不排除。其他用电包括电视、吹风机、洗衣机等,上述电器10天总用电量213.257千瓦时。其中70%以上的能量被空调使用,由于记录时间内天气炎热。冰箱和闪电的能源使用分别排在第二和第三位。对所用的其他能源进行了调整,最终数字为156.557+56.7*(1+20%)=224.597 kWh。排放的二手能源会产生温室气体(GHG),并进一步导致气候变化和全球变暖。温室气体排放量根据能源使用和排放因子(EF)计算。根据环境与能源部(2016年)的数据,西澳州的环境足迹为0.72。因此,我10天用电产生的温室气体为224.597X0.72=153.545(千克二氧化碳)。我用的电来自零售商的协同效应。
假设空调在1/4年内使用,我的家庭有两个人,我们共享20%的电力,我的家庭用电量估计为6170 kWh/年。根据ACIL Allen咨询公司的数据,珀斯的平均家庭用电量约为5800 kWh/年。(2015年)。因此,我的家庭消费比平均水平高6.4%。根据同一份报告,堪培拉的节约用电量为7470 kWh/年。因此,珀斯的电力消耗比堪培拉低28.8%。
The above table covered most of my electricity use in my living place, but not exclusive. Other electricity use includes television, hair dryer, washing machine and etc. The total energy use of the above appliances in 10 days is 213.257 kWh. Among which over 70% energy was used by air-conditioner, due to the hot weather during the recording time. The energy use of fridge and lightning ranked the second and the third places. An adjustment is made to include the other energy used and the final figure is 156.557+56.7*(1+20%)=224.597 kWh. The used energy emitted would create greenhouse gases (GHG) and further cause climate change and global warming. The GHG emission is calculated based on the energy use and Emissions Factor (EF). According to the Department of the Environment and Energy (2016), the EF of Western Australia is 0.72. Therefore, the GHG emitted from my 10-day useof electricity is 224.597x0.72=153.545(kg CO2). The electricity I used comes from the retailer Synergy.
Based on the assumption that air conditioner is use during 1/4 of the year and my household has two persons with the adjustment of 20% electricity is shared by us, my household consumption of electricity is estimated as 6,170 kWh/yr. The average household of electricity consumption in Perth is around 5,800 kWh/yraccording to Acil Allen Consulting (2015). Therefore, my household consumption is 6.4% higher than the average. Canberra’saverage electricity consumption is 7470 kWh/yr according to the same report. Thus Perth’s electricity consumption is 28.8% lower than Canberra.
III.
Proposals to achieve Net Zero Energy use
Net Zero Energy (NZE) should be pursued from the design and construction of a new building till the usage and operation of the building(McNabb 2013). Although facing enormous challenges and barriers, there are strategies and guidelines to achieve NZE building, such as green label and carbon footprint calculation systems (McNabb 2013).In a broad perspective regarding the construction industry, eco-innovation construction materials and techniques substituting natural resources can significantly promote NZE. The government may adopt mechanisms and policies to encourage competition and innovation on manufactures and suppliers.
Regarding my energy consumption status, the following proposals are presented to achieve NZE:
•
Renewable technology like solar panels could be used to generate electricity;
•
More efficient light technologies and day-lighting systems should be maximized to reduce lighting electricity consumption;
•
Shut down appliances’ power when not using them, since 20% energy use are consumed on standby power (EssentialEnergy 2011);
•
Cooking should use natural gas, which is a widely recognized energy efficient option(Essential Energy 2011);
•
When selecting appliances, the life cycle assessment (LCA) of the product should be considered to select environmental friendly products (Bribian, Capilla and Uson 2011);and
•
The awareness of achieving NZE should be raised and the lifestyle can be adjusted to achieve ‘Three Rs” to minimize energy waste, which are recycle, reuse and reduce (Bribian, Capilla and Uson 2011).
IV.
Conclusion
The negative impacts of global warming cannot be ignored anymore. What we can contribute is to develop NZE building through our professional knowledge and to consume less electricity and use renewable energy in our daily life. My 10-day energy use is recorded and compared with the average consumption of Perth and Canberra. I used more energy than the average in Perth. Several strategies are proposed to achieveNZE from both a broad perspective of NZE building and a narrow perspective of lifestyle.
References
Acil Allen Consulting. 2015. Electricity Bill Benchmarks for Residential Consumers. Australia.
Bribian, Ignacio Zabalza, Antonio Valero Capilla and Alfonso ArandaUson. 2011. “Life cycle assessment of building materials: Comparative analysis of energy and environmental impacts and evaluation of the eco-efficiency improvement potential”. Building and Environment 46: 1130-1140. doi:10.1016/j.buildenv.2010.12.002
Department of the Environment and Energy. 2016. National Greenhouse Accounts Factors.Commonwealth of Austria.
Essential Energy. 2011. “How Much Energy Do Your Appliances Use?” Australia.
McNabb, Nancy. 2013. Strategies to Achieve Net-Zero Energy Homes: A Framework for Future Guidelines.National Institute of Standards and Technology, USA.


 微信
微信


